Rat Cingulate Cortex & Disease Models (2 of 3)
Thalamic Afferents
Regional differentiation. The dense innervation of RSC by the anterior thalamic nuclei is well documented and the heavy labeling shown in Figure 6 confirms the heavy inputs from the anteromedial (AM), anteroventral (AV), and anterodorsal nuclei (AD) as well as the laterodorsal nucleus (LD) to this region. In the context of the regional divisions of cingulate cortex, it is crucial that these inputs differentiate each region. Horikawa et al. (1988) injected retrograde tracers into the "a" and "b" divisions of anterior and posterior area 24 (i.e., areas 24 and 24´) and their summary diagram is particularly instructive as to the differential projections of the anterior and laterodorsal thalamic nuclei. Area 24 receives primarily AM input, while area 24¢ receives mainly AM and AD afferents. Area 29 receives both of these plus a large input from AV and LD. Further support for the pACC/MCC distinction comes from Shibata (1993) who shows that area 24 receives more input from the interanteromedial nucleus, while area 24´ has a higher density of input from AM proper, although AM input is also shown to be extensive throughout the cingulate cortex. Finally, the midline and intralaminar thalamic nuclei differentiate between the pACC and MCC areas. The reuniens nucleus projects most intensely to areas 25 and 24 and less so to area 24´ (Herkenham, 1976), while the parafascicular nucleus projects to the deep layers of pACC (Marini et al., 1996). Thus, the three-region model demonstrated above with immunohistochemical, neurotransmitter receptor binding, and connections methods is supported by thalamic afferents.
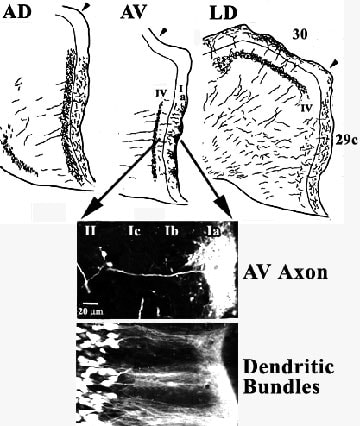
Projections to area 29. Reports by van Groen et al. (1993) and van Groen and Wyss (1995) provide important new details of the thalamoretrosplenial projection system and serve as the basis for interpreting the distribution of many neurotransmitter receptors in this region. Figure 8 documents the distributions of axons and dendrites from the former publication. The figure shows that each nucleus has a different area and laminar projection pattern with the AD and AV nuclei projecting mainly to granular area 29c and LD projecting to both area 29c and dysgranular area 30. The AD nucleus projects diffusely throughout layer I and the projection is more dense, although still diffuse throughout layers II and III. In contrast, AV projects mainly to layer Ia in cone-shaped clusters, an example of which is shown with individual axonal labeling with fluroruby. Other classes of axons terminate diffusely throughout the remainder of layer I and in a tight band in layer IV. Finally, LD projects mainly to layer I in areas 29c and 30, lightly to layer IV in area 29c, and densely to layer IV in area 30.
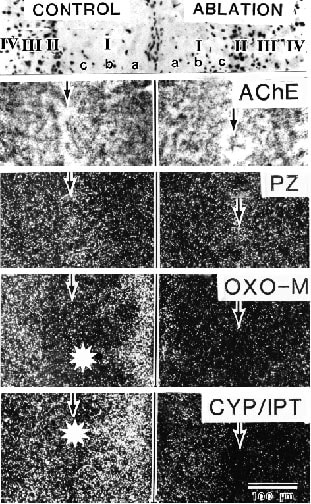
The fusiform pyramids of layer II have primary apical dendrites that form bundles in layers Ib and Ic and they splay out in layer Ia to form tangentially dispersed aggregates (Fig. 8; Dendritic Bundles). It appears that these bundles of apical tuft dendrites are targeted by axons from the AV nucleus as also shown in this figure. Indeed, the second major source of acetylcholinesterase activity in RSC, after that originating from the diagonal band of Broca (Fig. 6), is associated with anterior thalamic afferents. Figure 9 (AChE) shows high expression of AChE in layer Ia where AV axons terminate and greater than 50% loss of this activity following thalamic lesions (right side of Fig. 9; Vogt, 1984).
Figure 8. Laminar distribution of terminals from AD, AV, and LD in areas 29c and 30 following injections of Phaseolus vulgaris leucoagglutinin into each nucleus. The differential projection to layers in each area confirm key cytoarchitectural observations such as the presence of a layer IV in both areas based on AV projections to area 29c and LD projections to area 30. The clumps of terminals in layer Ia of area 29c provides a critical rationale for hypotheses that relate non-glutamate receptors with thalamic afferents. The arrows show a magnification of part of area 29c after labeling a single AV axon with Fluororuby. Its arborization may be juxtaposed onto the horizontally dispersed arbors of dendrites in the same layer that are here retrogradely labeled with Fluorogold in layer II of area 29c following a contralateral injection. The bundles of apical dendrites and their apical arborization throughout layer Ia may be associated with similarly shaped clumps of transmitter receptors in layer Ia (Fig. 9) and suggest that thalamic afferents are controlled by many heteroreceptor systems.
Axon terminal morphology and multiple heteroreceptor regulation. Projections of the anterior thalamic nuclei to RSC are glutamatergic (Gonzalo-Ruiz et al., 1997) and they form large axon terminals and asymmetric synapses with dendrites in layer Ia of area 29c that are consistent with a major excitatory pathway (Vogt et al., 1981). The high level of AChE activity in RSC is due to the fact that these terminals are postsynaptic to cholinerigic inputs rather than acetylcholine being a transmitter in this system. Transmitter receptors localized to these thalamocortical axon terminals not selective for glutamate and, therefore, are termed heteroreceptors. The laminar distribution of ligand binding autoradiography, layer Ia clumping, and effects of unilateral lesions in rat have suggested there are many heteroreceptors expressed by these glutamatergic terminals. Although the functions of these multiple heteroreceptor systems are not known, it is clear they can modify thalamocortical processing even before postsynaptic activation at the dendritic level (Vogt et al., 1995b). Furthermore, this complex presynaptic regulation does not appear to occur in area 29 of monkey (Vogt et al., 1997) and could be crucial to attempts to model primate diseases.
The unique clustering of AV thalamic input to area 29c, bilaminar projections to layers Ia and IV, and matched dendritic/axonal aggregates (Fig. 8) provide a valuable marker for assessing receptor localization in experimental autoradiographic ligand binding studies. The bundles of axons from the thalamus have been shown to express M2 binding with oxotremorine-M in the presence of unlabeled pirenzepine, b-adrenoceptor binding with cyanopindolol in the presence of isoproterenol, and µ-opioid binding with DAMGO as discussed above (Vogt et al., 1995b). Two binding patterns are shown for area 29c in Figure 9. In one pattern for pirenzepine, there is a modest peak in binding in layers II and III that is not abolished with thalamic lesions suggesting the muscarinic M1 receptors are expressed by intracortical neurons rather than extrinsic afferent axons (Vogt, 1984 for more details). The second binding pattern has binding peaks in layers Ia and III-IV similar to the distribution of AV axons (Fig. 8) and this bilaminar binding can be abolished with thalamic lesions as for oxotremorine-M and cyanopindolol binding (Fig. 9). The association of these latter populations of receptors with thalamic inputs is confirmed in the same cases with the loss of acetylcholinesterase activity and similar losses occur in DAMGO binding. Thus, M2, b adrenoceptor, and µ-opioid receptors are expressed by these thalamocortical terminals, although they may not all be expressed on the same axon terminal. Nonetheless, these multiple heteroreceptors provide for significant presynaptic regulation and might be relevant to interventions that engage gluatamatergic systems.
Figure 9. Superficial layer distribution of neurons (top), acetylcholinesterase (AChE), pirenzepine binding (PZ) autoradiography for M1 binding, oxotremorine-M binding in the presence of unlabeled PZ (OXO-M) autoradiography for M2 binding, and cyanopindolol binding in the presence of unlabeled isoproterenol (CYP/IPT) autoradiography for b-adrenoceptor binding in area 29c. Each layer is labeled in the top section for both hemispheres and there is a thalamic ablation in the right side. Note high activity of AChE in layers Ia and IV and high binding of OXO-M and CYP/IPT in the same layers. The latter ligands form clumps in layer Ia just like those of AV axons in Figure 8 and ablation of this input to area 29c abolished much AChE activity and binding of OXO-M and CYP/IPT but not PZ which is likely expressed by intrinsic cortical neurons.
NMDA Receptor, Antagonist-Induced Neurotoxicity In Retrosplenial Cortex
Extensive research focusing on the amino acid glutamate (Glu) has documented the central role played by this compound in both the normal and abnormal functioning of the CNS. Glu is the main excitatory neurotransmitter in the CNS and is released at up to half of the synapses in the brain. The Glu receptor family is comprised of two major subfamilies (ionotropic and metabotropic), and within these subfamilies there are many additional subdivisions. The ionotropic receptors are further subdivided into three major categories, each being named for an agonist molecule to which it is preferentially sensitive (NMDA, N-Methyl-D-Aspartate; AMPA, amino-3-hydroxy-5-methyl-isoxazole-4-proprionic acid; kainic acid, KA). Chapter 23 shows the distribution of binding to the glutamate receptors in cingulate cortex. Within each of these categories, multiple subunits and splice variants have been identified, and it is believed that these form heteromeric assemblies, the exact number and types of which remain to be determined. The most widely and densely distributed of the Glu receptor subtypes is the NMDA receptor. Several decades of work have shown that excessive activation of NMDA receptors (NMDA Receptor Hyperfunction; NRHyper) plays an important role in the pathophysiology of acute CNS injury syndromes such as hypoxia-ischemia, trauma and status epilepticus (Olney, 1990). More recently it has become apparent that excitation of NMDA receptors (NMDA Receptor Hypofunction; NRHypo) also can injure CNS neurons.
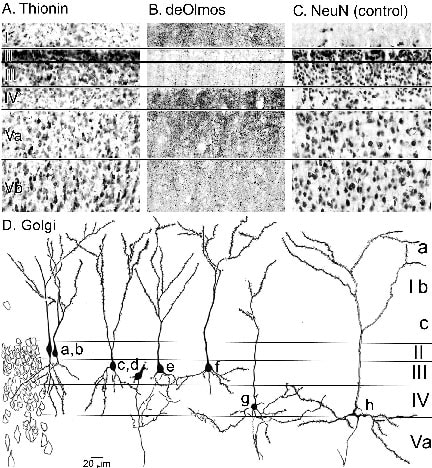
Pathomorphological response. At low doses, NMDA antagonists (e.g. MK-801, phencyclidine, ketamine, nitrous oxide, CPP, CPP-ene, CGS-19755), induce reversible pathomorphological changes (Olney et al., 1989) in layer IV-V pyramidal neurons of RSC. Figure 10 shows the laminar pattern of neuron death in deOlmos-silver stained sections. The greatest number of degenerating somata is in layers IV and Va and the associated degenerating dendrites form bundles in layers II and III and massive terminations throughout layer I. The loss of neurons in layer IV and Va is prominent in thionin-stained sections, particularly when compared to a control case stained for NeuN. Although the thionin section shows a small amount of damage to the top of layer Vb via pale staining and some shrinkage of neurons, most of the degeneration in layer Vb (Fig. 10) is associated with descending axons as noted in a subsequent figure.
Pathomorphological response. At low doses, NMDA antagonists (e.g. MK-801, phencyclidine, ketamine, nitrous oxide, CPP, CPP-ene, CGS-19755), induce reversible pathomorphological changes (Olney et al., 1989) in layer IV-V pyramidal neurons of RSC. Figure 10 shows the laminar pattern of neuron death in deOlmos-silver stained sections. The greatest number of degenerating somata is in layers IV and Va and the associated degenerating dendrites form bundles in layers II and III and massive terminations throughout layer I. The loss of neurons in layer IV and Va is prominent in thionin-stained sections, particularly when compared to a control case stained for NeuN. Although the thionin section shows a small amount of damage to the top of layer Vb via pale staining and some shrinkage of neurons, most of the degeneration in layer Vb (Fig. 10) is associated with descending axons as noted in a subsequent figure.
Figure 10. Systemic MK-801 produces neuronal palor and gliosis in layers IV and Va of area 29c (A. Thionin) compared to the distribution of normal neurons (C. NeuN-control). Silver-stained dendrites are prominent in layers I and IV-Va as are ascending dendritic bundles in layers II/III and somata in layers IV and Va. Although some neurodegeneration is in layer Vb, most of the argyrophilia is associated with descending axons (Fig.11). Besides medium-sized neurons that express the pathomorphological response in layer Va, layer IV degeneration is mainly by star payramids (D. neurons g and h). Neurons in layer II include the fusiform pyramids and in layer III the star pyramids with mainly descending basal dendrites; neither of these latter two groups of neurons have the pathomorphological response.
One type of neuron destroyed by this reaction is the medium-sized pyramidal neuron of layer Va. Less obvious, are the types of neurons that degenerate in layer IV. The Golgi illustrations in Figure 10D show that layer II is comprised of fusiform pyramids (a, b), layer III of star pyramids with basal dendrites that project into layer IV (c-f) and layer IV star pyramids with horizontally dispersed, basal dendritic trees (g, h). The apical dendrites of these latter neurons ascend throughout layers III, II, Ib and Ic and arborize primarily in layer Ia. It is these latter neurons along with the medium-sized pyramids in layer Va that express much of the pathomorphological response following NMDA antagonist exposure. The pathomorphological injury consists of swollen mitochrondria and endoplasmic reticulum. If NMDA receptor blockade is maintained for a prolonged interval, as occurs following a single high dose or repeated treatment with lower doses of an NMDA antagonist, neurons in the RSC and several other cerebrocortical and limbic regions of the adult rat brain undergo irreversible degeneration as reviewed recently (Farber et al., 2002).
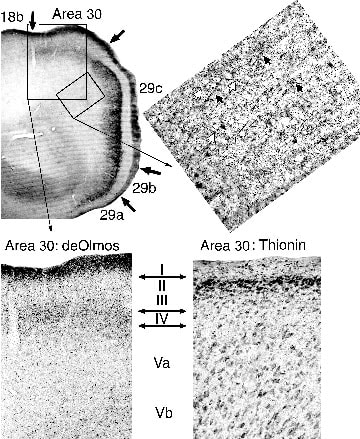
Area 30 deafferentation following the pathomorphological response. The precise localization of the pathomorphological response, provides a unique opportunity to view an important intracingulate connection from granular to dysgranular retrosplenial areas. Figure 11 shows a low magnification of RSC in a deOlmos-silver stained section as well as higher magnification of the distribution of degenerating axons. In the rectangle of tissue in area 29c, there are bundles of degenerating axons that descend beneath the lesion in layer V. Projecting from these bundles at oblique angles and oriented toward area 30 are many individual axons that likely do not penetrate into the white matter but make a brief excursion directly to the adjacent area. Since there are no degenerating neurons in area 30 and amino acid injections into area 29c have a halo of transported proteins around the injection site and extending into area 30 (Vogt and Miller, 1983), there is evidence in this material for a direct projection from area 29a-c to area 30. Support for this observation comes from analyzing the perilesion cortex in the MK-801 injected animals. Bundles of descending axons are emitted from the beneath the area 29c pathomorphological response and branches penetrate superficial layers where they terminate in layers I, III, and IV of area 30 as shown in the higher magnification rectangle in Figure 11 where a thionin-stained section is provided for demonstration of the laminar boundaries in the silver-stained section. The direct connection demonstrated in the MK-801-ablated tissue raises two issues. First, although these areas are structurally very different and both project independently to visual cortex, they are reciprocally connected (see amino acid injections in Vogt and Miller -1983- for reciprocal projection to area 29c) and their functions are not independent. Indeed, they may contribute differently but in parallel to visuospatial processing. Second, functional deficits following MK-801 toxicity are not solely the result of damage to granular areas 29a-c but also deafferentation of other cortices including area 30.
Figure 11. Selective pathomorphological response in area 29a-c allows evaluation of intracingulate projections to area 30 (same case in Fig.10). The obliquely oriented rectangle shows a high magnification of descending bundles of axons emitted from the lesion (black arrows) and obliquely oriented axons that are oriented toward area 30 (white arrows). Termination in area 30 (larger rectangle) is mainly in layer I but also in layers III and IV. The cytoarchitecture of area 30 is shown in the thionin section and this emphasizes that area 30 does not express the pathomorphological response.
Polysynaptic Circuit Disinhibition Underlies NRHypo Neurotoxicity
Cholinergic system. After the initial report of reversible neurotoxicity, it was found that GABAA receptor agonists and muscarinic receptor antagonists blocked the reversible neurotoxic reaction (Olney et al., 1991) and it was proposed that certain GABAergic inhibitory neurons receive tonic glutamatergic input via NMDA receptors and these neurons form inhibitory synapses onto cholinergic neurons. NMDA antagonists, by blocking stimulation of GABAergic inhibitory neurons, would cause a loss of GABAergic inhibitory control over excitatory cholinergic neurons that innervate RSC. The resultant excessive cholinergic stimulation of RSC neurons would be the proximal event to produce neuronal injury (Olney et al., 1991; Fig. 14). Based on the relative potencies of a large number of anti-muscarinic compounds to prevent NRHypo neurotoxicity, it was determined that an m3 receptor was the most likely subtype of muscarinic receptor that was over-stimulated on the injured neuron (Farber et al., 2002); however, an m1 subtype could not be excluded. Consistent with the latter proposal, NMDA antagonists produce excessive release of acetylcholine (Kim et al. 1999) in the cerebral cortex and GABAergic agents can reverse this increase (Kim et al., 1999). In addition scopolamine, when injected directly into the RSC, prevents the damage caused by systemic injection of MK-801 (Farber et al., 2002), confirming that excessive activation of muscarinic receptors in the RSC is necessary to produce the damage. Because there are cholinergic neurons in RSC (Johnston et al., 1981; Olney et al., 1993), this circuit was conceived initially as being intrinsic to RSC. However, MK-801 directly applied to the RSC did not cause an increase in acetylchoine release (Kim et al., 1999) nor did it produce the neurotoxicity (Farber et al., 2002) indicating the cholinergic neurons and the NMDA-receptor bearing GABAergic neurons that control them are not in RSC. Injection of muscimol, a GABA agonist, directly into the diagonal band of Broca, where cholinergic neurons that project to the RSC are located (Fig. 6), prevents NRHypo neurotoxicity (Jiang et al., 2001). Thus, the disinhibition of diagonal band cholinergic neurons by NMDA antagonists may result in the excessive stimulation of muscarinic receptors in the RSC.
Adrenergic system. A large number of α2 adrenoreceptor agonists administered systemically prevent the neurotoxic reaction, and this protection can be reversed by α2 adrenergic antagonists (Farber et al., 1995a). The ability of α2 adrenoreceptor agonists to prevent the increase in acetylcholine release induced by NMDA antagonists (Kim et al., 1999) indicates that α2 adrenoreceptor agonists control cholinergic neurons in the diagonal band (Fig. 12). Injection of clonidine, an α2 agonist, into the diagonal band prevents the toxicity, while clonidine in RSC does not (Farber et al., 2002).
continue to Page 3
